Text & Writing
AI Assistant
AI chatbots
AI Detection
Blogging platforms
Books
Chat
Chatbots
Chatgpt
ChatGPT Prompts
Content Creation
Copywriting
Email
Email Assistant
Email clients
General Writing
Messaging apps
Note and writing apps
Paraphraser
Prompt Guides
Prompts
Prompts Guides
Speech-To-Text
Stories
Story Teller
Summarizer
Translation
Wordpress
Writing
Image & Design
AI generative art
Art
Art Generation
Avatar
Avatar generators
Avatars
Design
Design Assistant
Design inspiration websites
Design mockups
Design resources
Graphic design tools
Icon sets
Image editing
Image Generation
Image Generator
Images
Images Scanning
Inspiration
Interface design tools
Logo generator
Mobile editing apps
Notion Templates
Photo editing
Photo sharing
Profile Pictures
Stock photo sites
Text-to-Image
UI frameworks
Wallpapers
Audio & Music
Video & Animation
Marketing & Sales
Advertising
Affiliate marketing
AI Search Engines
Branding
E-commerce
Ecommerce platforms
Email marketing
Interior Design
Marketing
Marketing automation platforms
Marketplace sites
Real Estate
Sales
Search
Search Engine
SEO
SEO analysis tools
Shopify Apps
Shopping
Social audio apps
Social Media
Social Media Assistant
Social media management tools
Social Networking
Lifestyle & Entertainment
Development & IT
Business & Admin
Accounting software
Aggregators
AI
App switcher
Business
Business intelligence software
Calendar apps
Chrome Extensions
Community management
CRM software
Crypto
Crypto tools
Customer Service
Customer support
DAOs
Data analysis
Data analysis tools
Data visualization tools
Digital whiteboards
Document Search
File storage and sharing
Finance
Financial planning
Investing
Investment
Keyword research tools
Knowledge base software
Lead generation software
Legal
Legal Assistant
Legal services
Medical
Meeting assistant
Meeting software
Name Generator
Presentation Software
Presentations
Productivity
Professional networking platforms
Project management
Project management software
Scheduling software
Slack apps
Startup
Startup communities
Startup financial planning
Startup tools
Stocks
Survey and form builders
Trading

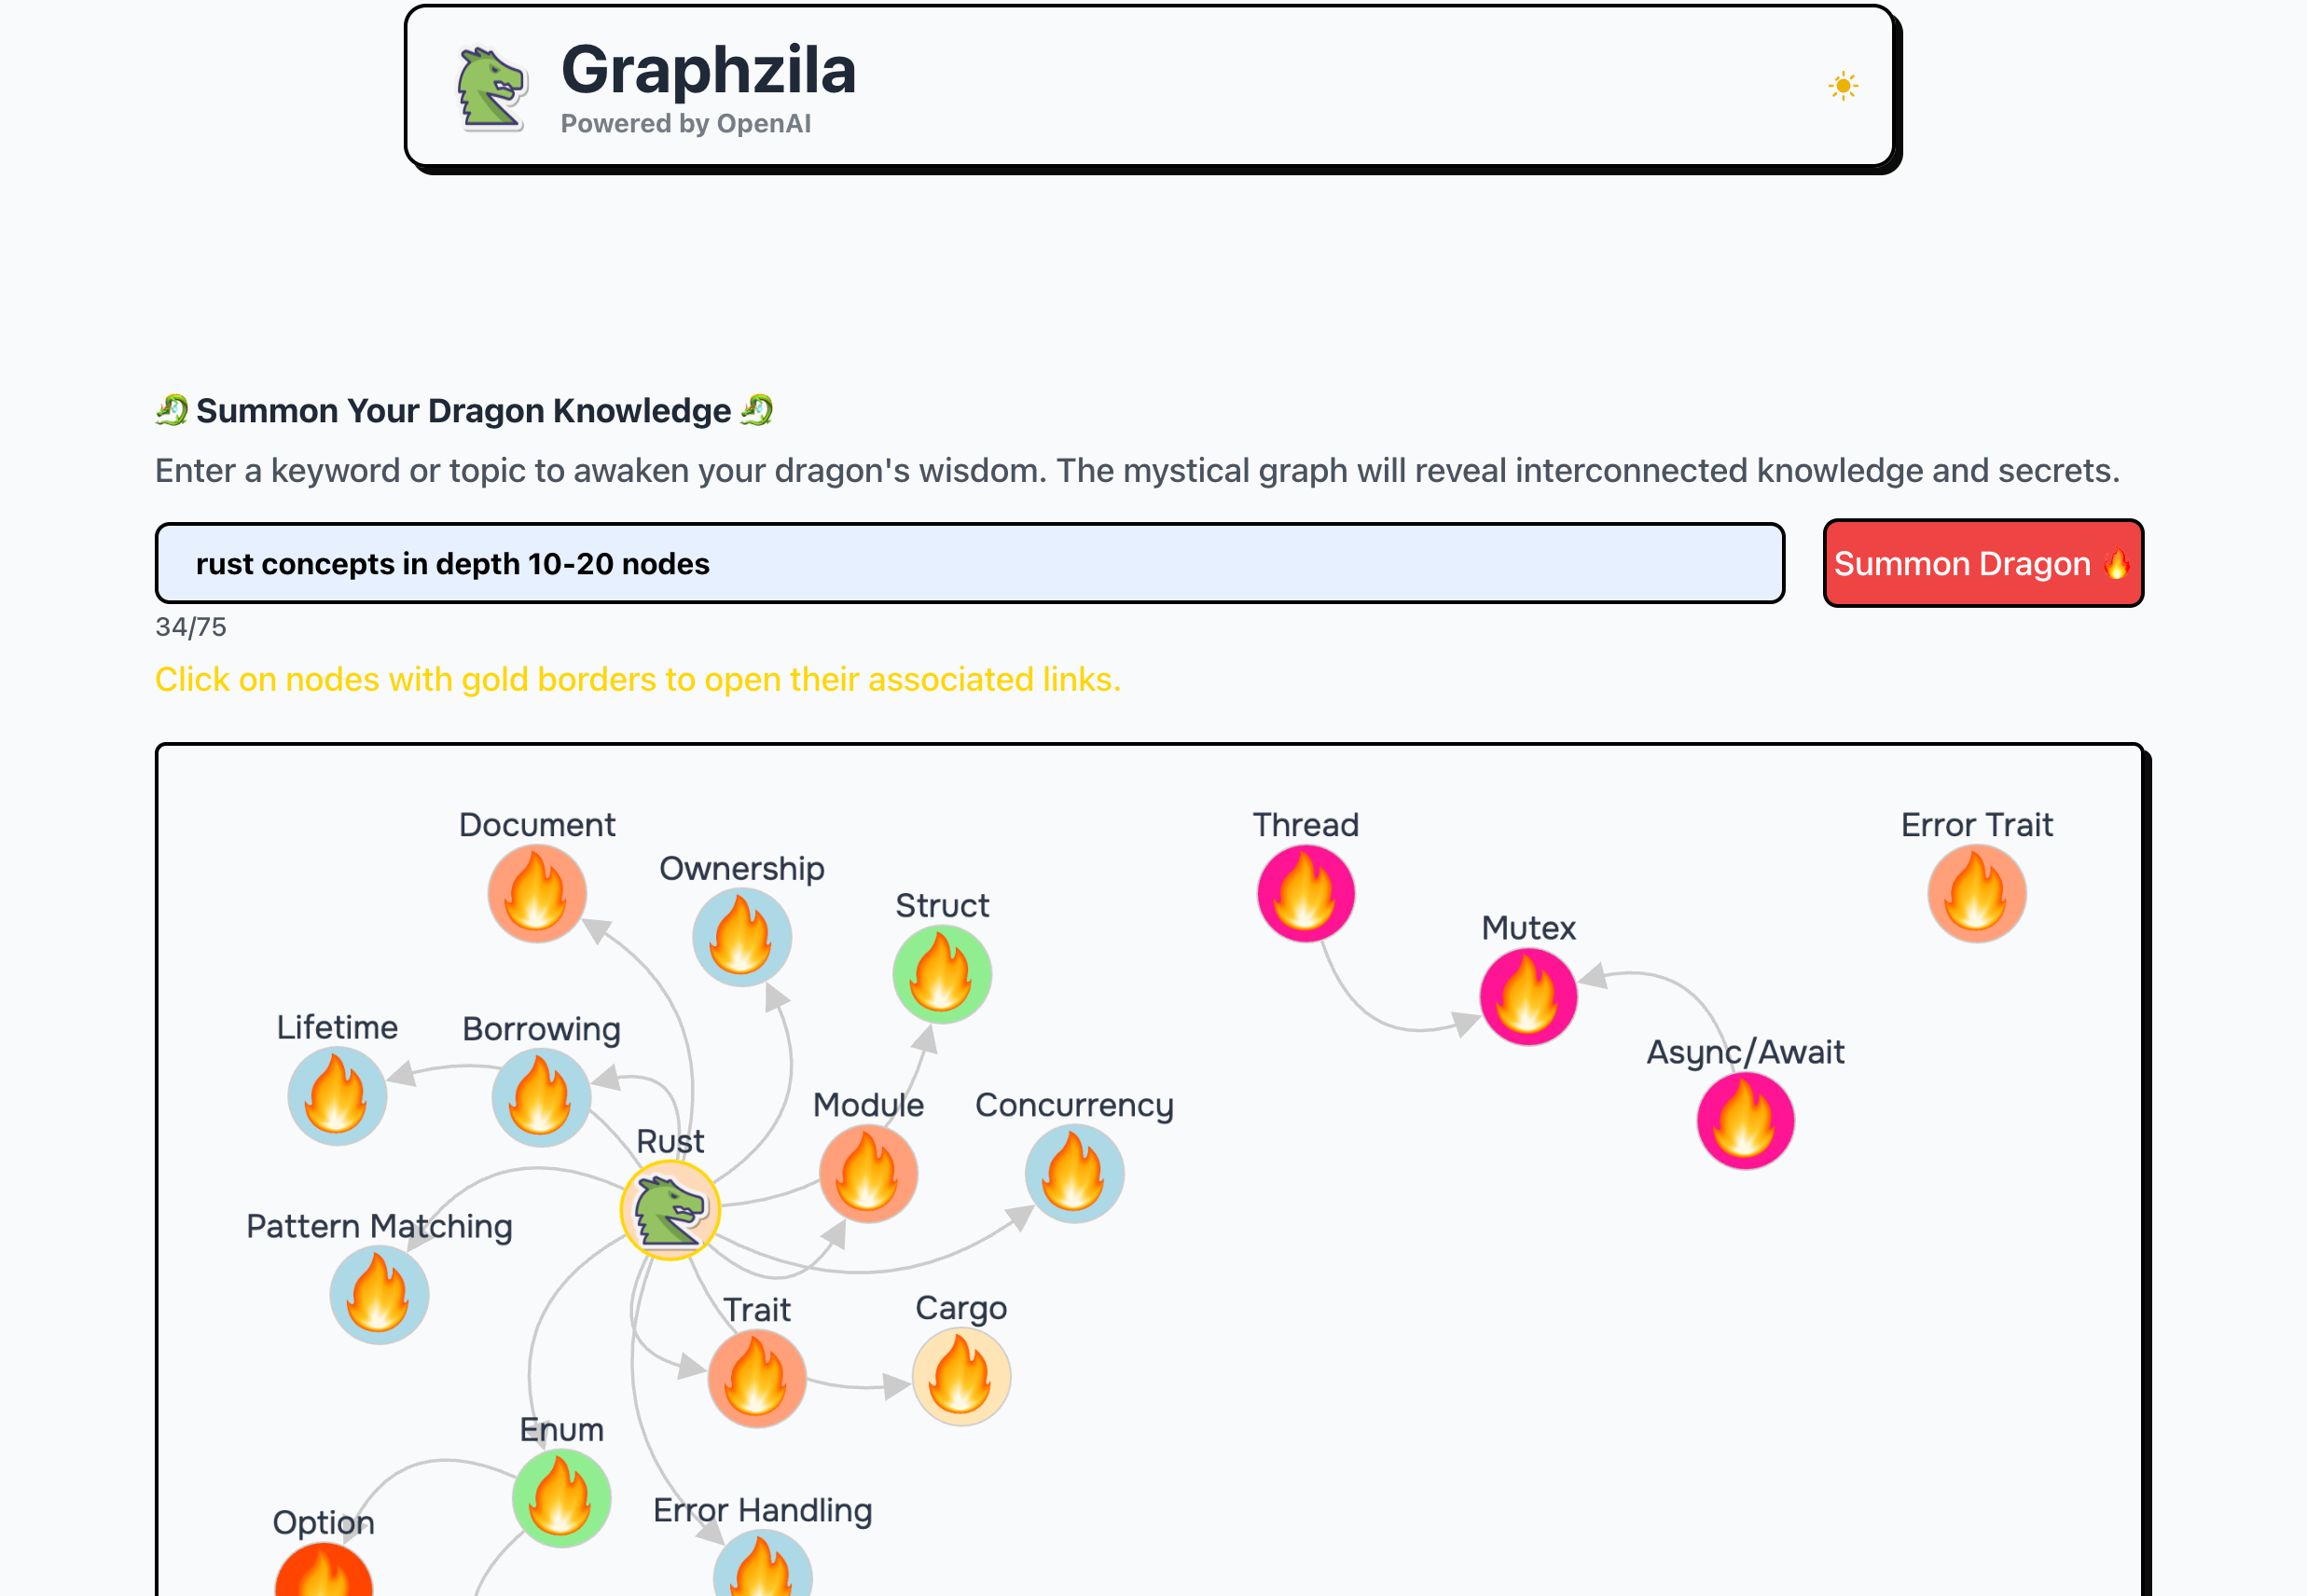
Graphzila
Graphzila.com is an AI-powered tool that helps users create high-quality charts and visualizations from their data. It uses natural language processing (NLP) to allow users to input their data and instructions in plain English, and then generates customized charts and graphs based on their requirements.
Graphzila provides an AI-powered solution for creating data visualizations and charts without coding, making it accessible for users of all skill levels.
Pricing
- Free trial available
- Pro plan starting at $19/month
- Business plan starting at $99/month
- Enterprise pricing available for larger organizations
Pros
- Easy to use, no coding skills required
- Supports a wide range of chart types
- Ability to customize colors, labels, and other elements
- Shareable and embeddable visualizations
- Integrates with various data sources
Cons
- Limited control over advanced customization options
- Potential for errors in data interpretation
- Subscription plans may be costly for some users
Use Cases
- Creating data visualizations for reports and presentations
- Generating charts for blogs and website content
- Visualizing data for market research and analysis
- Creating infographics and data-driven social media content
Target Market
- Business professionals and analysts
- Marketing and communication teams
- Researchers and academics
- Data journalists and content creators
Competitors
- Datawrapper
- Flourish
- RAWGraphs
- Chartio
Copyright © Product Cards 2023